Driving Towards Net Zero
At Promega UK, we recognise that reducing carbon emissions is essential to building a sustainable future. As a life sciences supplier, we have a responsibility to minimise our environmental footprint while continuing to support scientific innovation. That’s why we are committed to achieving Net Zero emissions by 2045.
In this post, we will share our carbon reduction targets, the progress we have made, and our roadmap for the future.
Our Carbon Reduction Targets
We’ve set some ambitious targets to drive down our carbon emissions:
- Scope 1: 100% reduction by 2030
- Scope 2: Maintain the 100% reduction achieved in 2022
- Scope 3: 100% reduction by 2045
Our ultimate goal is Net Zero across all these areas. This is why these targets matter and how we track them.
Understanding the Basics of Carbon Accounting
The first step in reducing carbon emissions is to identify where they come from. Although the data might not be of high quality initially, it should still help spot the most significant activities so that an organisation can plan properly.
At the moment, Promega UK are not legally required to produce carbon accounts, although we have contributed data to Promega Corporation’s global report for several years. As part of our reporting, we wanted to examine our own UK-specific activities more closely, so for transparency, we have decided to prepare our own UK accounts. We follow the standard outlined in the UK government’s public procurement guidelines (PPN 21/06).
Currently, the Intergovernmental Panel on Climate Change (IPCC) does not endorse any single reporting standard. Instead, it sets minimum requirements that any standard should meet. We use the Greenhouse Gas (GHG) Protocol Corporate Standard because it meets the UN’s requirements and is by far the most commonly used reporting approach.
Scopes 1, 2, and 3
To break down emissions, carbon accounts are divided into three scopes:
Scope 1 emissions: Direct emissions from equipment or processes under our control (e.g. gas boilers, refrigerant leaks, leased vehicle emissions).
Scope 2 emissions: Emissions from the energy we consume. For us, this is electricity, although for some organisations it could include steam or hot water purchased rather than generated on-site.
Scope 3 emissions: Emissions from all goods and services we buy in. This covers flights, trains, stationery suppliers, building materials, cloud computing services—everything external to Promega UK.
Organisations have direct control over Scope 1, whereas suppliers control Scope 2 and 3. These suppliers range from one-person window cleaning firms, that do not track carbon footprints at all (but can be responsive to customer needs), to large courier companies that estimate their emissions well but are not easily influenced.
The balance of emissions across these three scopes varies by industry, for example:
- Professional services (accountancy, legal, HR) typically have most of their emissions in Scope 3
- Light manufacturing and distribution often have more Scope 1 and 2 emissions than professional services, particularly if they have a significant physical presence
- Heavy manufacturing and transport usually have a high proportion of Scope 1 emissions compared to other organisations
At Promega UK, our physical UK presence is relatively small, but upstream and downstream distribution can be carbon-intensive, largely due to the temperature-sensitive nature of many of our goods.
Digging Into Our Data
We compare our carbon emissions to a baseline year, usually the first year with complete data. Our baseline is 2022:
- 2022 was our first attempt at UK-specific data, gathered with the help of an external consultancy.
- 2023 data was largely prepared in-house (with some consultant input), building on what we learned in 2022, and reviewed by Promega Corporation and an external consultancy.
The table below sums up how our reported emissions changed from 2022 to 2023:
Promega UK Emissions
| 2022 CO2e | 2023 CO2e | |
|---|---|---|
| Total | 193.2t | Market Based: 609.0t |
| Location Based: 682.8t | ||
| Scope 1 | 126.94t | 100.6t |
| Scope 2 | 0t | MB: 0.8t |
| LB: 74.6t | ||
| Scope 3 Total | 66.26t | 608.6t |
| Purchased goods and services | 30.76t | 29.0t |
| Upstream distribution | 417.4t | |
| Business travel | 12.49t | 61.0t |
| Waste generated in operations | 0.22t | 0.21t |
| Employee commuting | 3.79t | 2.8t |
| Downstream distribution | 19t | 98.2t |
Why Have Emissions Changed So Much?
At first glance, our reported emissions appear to have tripled between 2022 and 2023. However, this increase is not due to higher actual emissions but rather to more detailed and accurate reporting. Here’s the most significant changes:
- Dry Ice Accounting
We ship temperature-controlled products using dry ice (solid CO₂). As it sublimates into gaseous CO₂, it is counted under Scope 1. Historically, CO₂ for dry ice in Europe has often come from fossil fuels as a by-product of ammonia production. However, one of our suppliers sources its CO₂ from biogas, making this aspect carbon neutral. In 2023, we accounted for that supplier’s biogas-based CO₂, which explains why our Scope 1 emissions are lower. - Inclusion of Upstream Distribution
The jump in Scope 3 is due to including upstream distribution figures this year and improving the accuracy of all of our scope 3 calculations, but most notably our downstream emissions calculation. We did not have those numbers in 2022, so the real emissions have not drastically changed—our reporting is simply more thorough.
Market-Based vs. Location-Based Emissions
You will also see two sets of figures for 2023: market-based and location-based. These describe how much carbon was used to generate the electricity we consume:
- Market-Based: When organisations purchase an all-renewable tariff, it can be accounted for as causing zero emissions. This approach incentivises renewable energy production because generators can sell green power at a premium. It is backed by a government scheme (REGO) ensuring suppliers only sell their green power once.
- Location-Based: This shows the actual mix of the national grid, which is what is effectively drawn from day to day.
In 2022, we only published one figure. In 2023, we followed best practice by publishing both.
Efforts to Reduce Emissions
- Scope 1
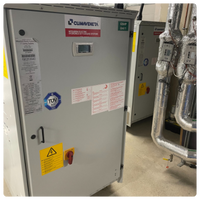
Our Scope 1 emissions are relatively low because we use ground source heat pumps for heating and cooling. These run on electricity rather than gas or oil, meaning our only significant Scope 1 sources are dry ice and backup generator use. We are transitioning our backup generator to biofuel, and we are working towards carbon-neutral dry ice suppliers. - Scope 2
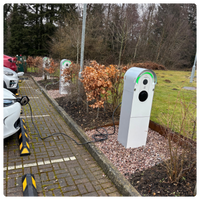
We buy 100% renewable electricity for our UK facility. This makes our building’s heating, cooling, and power effectively carbon-free in a market-based sense. However, as we transition our vehicle fleet to electric, we sometimes charge vehicles on public networks, and not all of these draw on green energy. That is why market based emissions are no longer zero. In 2024, we installed solar panels on-site to reduce our grid usage. - Scope 3
Scope 3 is our next major focus. We aim to work closely with our top suppliers to encourage them to reduce their carbon footprints and improve training for our employees, so that everyone understands how to make more sustainable choices.

Conclusion
As a life sciences organisation, we know how crucial the scientific community is in tackling climate change. At Promega UK, we are proud to show that scientific excellence and sustainability can go hand in hand.
Reducing carbon emissions is not just a corporate responsibility; it is central to our mission of supporting scientists while preserving the planet for future generations. Through innovation, investment, and collaboration, we remain committed to achieving Net Zero by 2045 and to setting a high standard for sustainability in the life sciences sector.
We hope you will join us on this journey, whether you are a partner, supplier, or fellow member of the scientific community. If you are further along in your carbon reduction work, we applaud you and hope to learn from you. If you have not yet begun, we hope we can inspire you. Either way, together we can build a greener, healthier future for everyone
Interested in learning more about our green initiatives?
Visit the UK Corporate Sustainability Page or follow us on LinkedIn, Facebook, X or Instagram.